Lab 1: The Simple Pendulum
The simple pendulum consists of a small object suspended from a light string. When the object is displaced to the side and then released, the pendulum will oscillate back and fourth about the vertical position. Such oscillation is a form of simple harmonic motion, assuming the angular displacement is kept relatively small.
Objectives
After completing this experiment, you should be able to
- discuss the relation between period of oscillation and parameters like mass, amplitude and length of a pendulum.
- generate linear graphs from nonlinear equations.
- perform simple error analysis.
Reading Assignment
Before starting this experiment, make sure you read
- sections 11-1 to 11-4 in the eText.
- the introduction from the PHYS 200 Lab Guide.
- the proposed theory to be tested in this experiment.
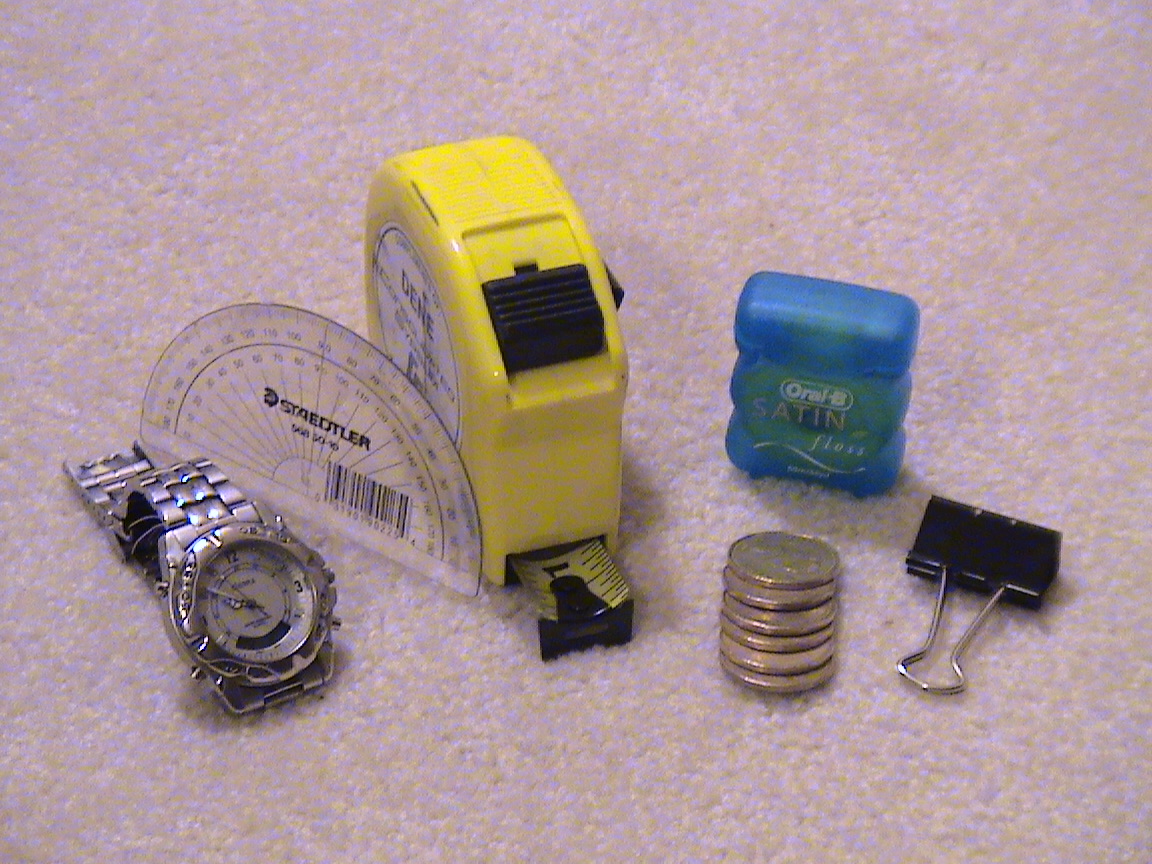
Equipment
For this experiment, you need to supply a strong but relatively light string about 1 m long. Regular dental floss should work well. You also need about six coins of the same type, preferably loonies or toonies, to be used as masses. To hold the coins, a medium size binder clip is included in the lab kit. You will also find a protractor for angle measurements. For making length measurements, you should provide a measuring tape or a metrestick. To measure the time, you can use, for example, the stopwatch app on your smartphone or the Clock app in Windows on your computer.
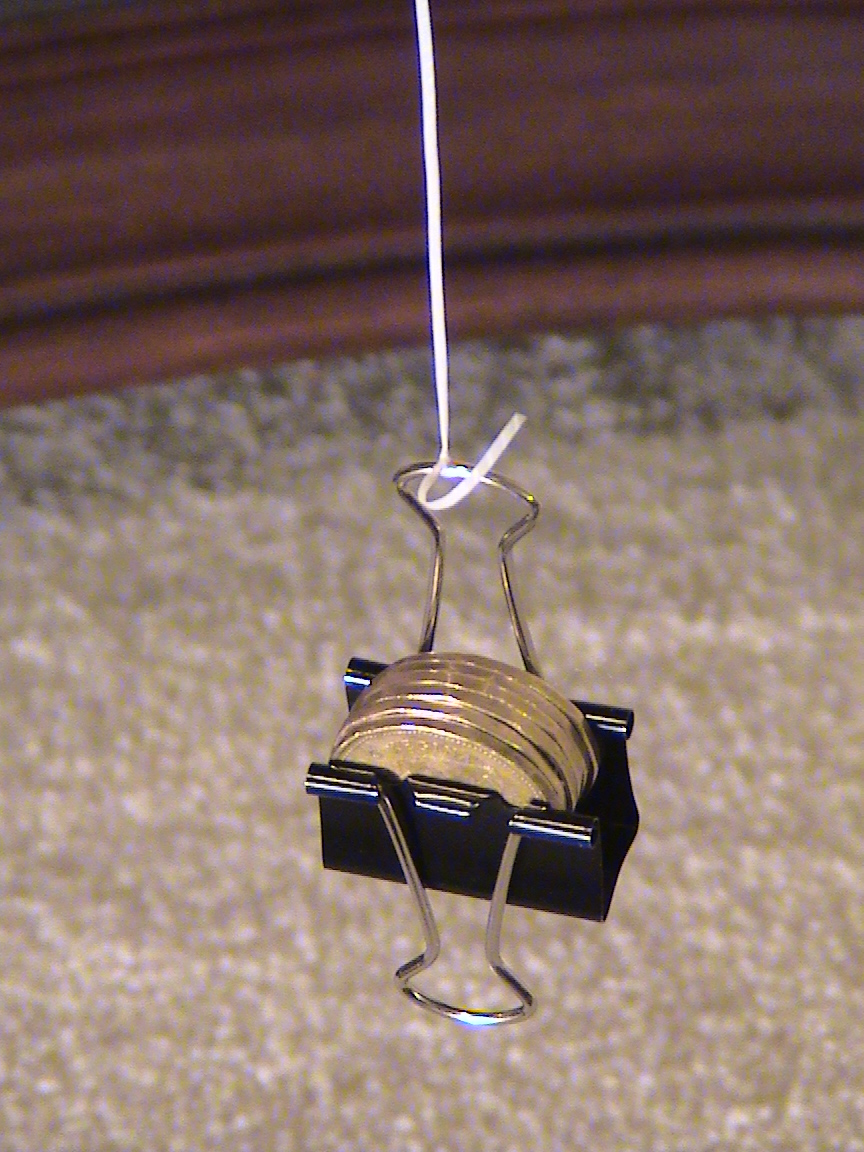
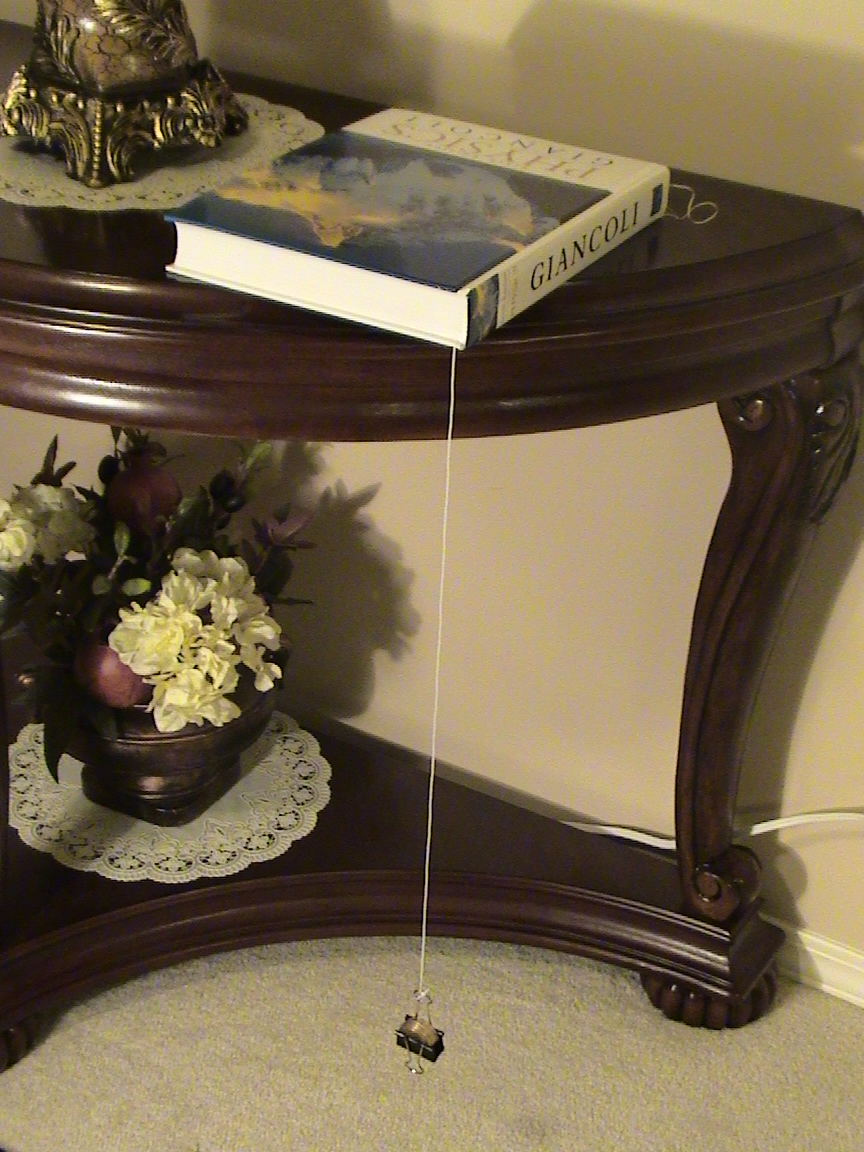
Procedure
When you are ready to start the experiment, please follow this procedure for the setup and data collection.
The pictures referred to in the procedure appear below (click to enlarge).
 |
 |
 |
Picture 1 |
Picture 2 |
Picture 3 |
The video below shows a pendulum making 10 oscillations.
 |
Video 1 |
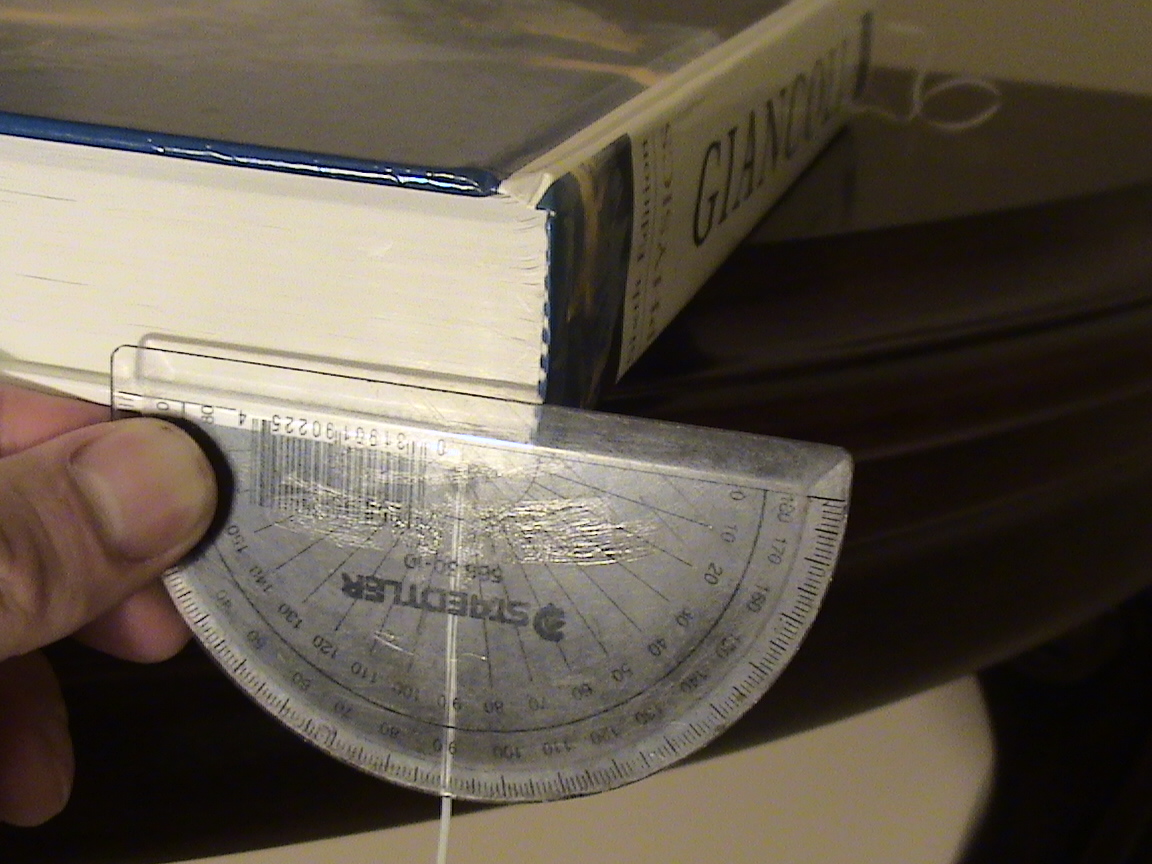
Analysis and Discussion
In this part of the lab, you will discuss the validity of the proposed theory, based on your measurements and the data collected. You may choose the appropriate method to analyze your data and make your arguments. Your analysis and discussion must be relevant, convincing, and conclusive. Where appropriate, support your writing with graphs, diagrams, and detailed calculations. Logger Pro is a useful tool for generating graphs and performing appropriate curve fits.
Here are guidelines for the analysis and discussion. Click on the thumbnails below for the pictures referred to in this section.
 |
 |
Picture 4 |
Picture 5 |
Questions
Answer the following questions in detail at the end of your lab report.
Estimate the length of the pendulum in Video 1.
Video 1
- What would be the oscillation period of the pendulum shown in Video 1 if it is on the surface of the moon?
Prepare your lab report for this experiment and submit it for marking.